
Fish Pie vs Kippers
Overall, Fish Pie has the better nutritional profile on the measures we compare. It wins on 7 of our comparison points versus 2.

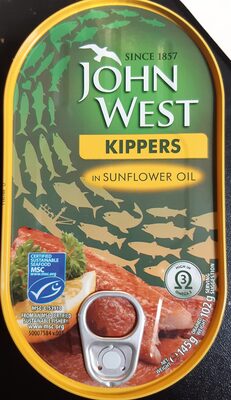
Nutrition per 100 g
| Nutrient | Fish Pie | Kippers |
|---|---|---|
| Nutri-Score | b | d |
| NOVA group | 3 | 3 |
| Calories | 111 kcal | 238 kcal |
| Fat | 4.9 g | 18 g |
| Saturated fat | 2.4 g | 3.6 g |
| Sugars | 0.9 g | 0 g |
| Salt | 0.6 g | 1.5 g |
| Fiber | 0.8 g | 0 g |
| Protein | 7.8 g | 19 g |
| Additives | 2 | 0 |
| Allergens | Crustaceans, Fish, Gluten, Milk, Molluscs | Fish |
Green = better value for that nutrient (less sugar, fat, salt and calories; more fiber and protein).
Key differences
- Fish Pie has 53% fewer calories (111 kcal vs 238 kcal).
- Fish Pie has 73% less fat (4.9 g vs 18 g).
- Fish Pie has 33% less saturated fat (2.4 g vs 3.6 g).
- Kippers has no sugar, while Fish Pie has 0.9 g.
- Fish Pie has 61% less salt (0.6 g vs 1.5 g).
- Fish Pie has 100% more fiber (0.8 g vs 0 g).
- Kippers has 59% more protein (19 g vs 7.8 g).
- Fish Pie has the better Nutri-Score.
- Only Fish Pie lists: Crustaceans, Gluten, Milk, Molluscs.
Ingredients
Fish Pie
Potatoes (37%), Whole Milk, Cod (Fish) (8%), Smoked Haddock (8%) (Haddock (Fish) (98%), Water, Salt), King Prawns (Crustacean) (7%), Scottish Salmon (Fish) (6%), Scallops (Mollusc) (4.5%), Double Cream (Milk), West Country Butter (Milk), Fish Stock (Water, Fish Bones, Prawn Shells (Crustacean), Onions, White Wine, Carrots, Salt, Leeks, Tomato Paste, Fennel, Lemon Juice, Parsley, Garlic, Dried Thyme, Ground Bay Leaves, White Peppercorns, Black Peppercorns), Wheatflour, Dried Potatoes, Butter (Milk), Cornflour, Sea Salt, West Country Mature Cheddar Cheese (Milk), Sauvignon Blanc White Wine, Lemon Juice, Smoked Water, Rapeseed Oil, Sunflower Oil, Parsley, Salt, Raising Agent: Sodium Bicarbonate, Garlic Puree, Ground White Pepper, Olive Oil, Dill, Ground Bay Leaves, Yeast
Kippers
Smoked Kipper Herring Fillets (Fish), Sunflower Oil, Salt.
FAQ
Which is healthier: Fish Pie or Kippers?
Overall, Fish Pie has the better nutritional profile on the measures we compare. We compare Nutri-Score, processing level and seven nutrients per 100 g. Your own needs (for example low sugar or high protein) may make a different choice better for you.
Which has fewer calories?
Fish Pie has fewer calories: 111 kcal versus 238 kcal per 100 g.
Which has less sugar?
Kippers has less sugar: 0 g versus 0.9 g per 100 g.