
Trail Mix Crackers vs Power up
Overall, Trail Mix Crackers has the better nutritional profile on the measures we compare. It wins on 4 of our comparison points versus 2.
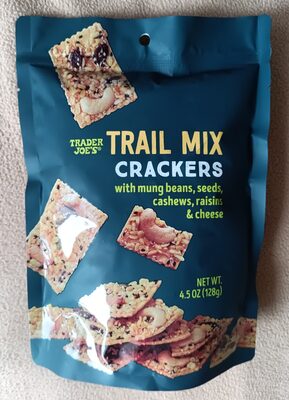
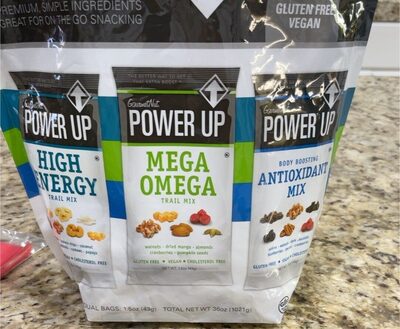
Nutrition per 100 g
| Nutrient | Trail Mix Crackers | Power up |
|---|---|---|
| Nutri-Score | d | d |
| NOVA group | 4 | 3 |
| Calories | 500 kcal | 465 kcal |
| Fat | 23.5 g | 23.3 g |
| Saturated fat | 7.4 g | 9.3 g |
| Sugars | 11.8 g | 39.5 g |
| Salt | 0.7 g | 0.2 g |
| Fiber | 5.9 g | 4.7 g |
| Protein | 14.7 g | 4.7 g |
| Additives | 6 | 1 |
| Allergens | Gluten, Milk, Nuts, Sesame seeds, Soybeans | Nuts |
Green = better value for that nutrient (less sugar, fat, salt and calories; more fiber and protein).
Key differences
- Trail Mix Crackers has 21% less saturated fat (7.4 g vs 9.3 g).
- Trail Mix Crackers has 70% less sugar (11.8 g vs 39.5 g).
- Power up has 76% less salt (0.2 g vs 0.7 g).
- Trail Mix Crackers has 21% more fiber (5.9 g vs 4.7 g).
- Trail Mix Crackers has 68% more protein (14.7 g vs 4.7 g).
- Power up is less processed (lower NOVA group).
- Only Trail Mix Crackers lists: Gluten, Milk, Sesame seeds, Soybeans.
Ingredients
Trail Mix Crackers
CHEESE CRACKER BLEND (WHEAT FLOUR, RICE BRAN OIL, SUGAR, CHEESE POWDER (CHEESE {MILK, SALT, STARTER CULTURE, MICROBIAL ENZYME, ANNATTO EXTRACT (COLOR), BETA CAROTENE (COLOR)}, SODIUM PHOSPHATE, WHEY POWDER), MILK POWDER, BAKING SODA, SALT, BETA CAROTENE [COLOR], SOY LECITHIN), FRIED MUNG BEANS (MUNG BEANS, PALM OIL, SALT), CASHEWS, SUGAR SYRUP (WATER, GLUCOSE SYRUP [TAPIOCA STARCH], SUGAR), RAISINS (RAISINS, SUNFLOWER OIL), WHITE SESAME SEEDS, PUMPKIN SEEDS, BLACK SESAME SEEDS. CONTAINS MILK, SOY, SESAME, WHEAT, CASHEW. MAY CONTAIN EGG, PEANUT, ALMOND.
Power up
dried cranberries (cranberries, sugar, sunflower oil), dried mango (mango, sugar, citric acid) [product of thailand], roasted almonds (almonds, sunflower and/or canola oil), walnuts, pumpkin seeds [product of china), er contains: tree nuts (almonds, walnuts),
FAQ
Which is healthier: Trail Mix Crackers or Power up?
Overall, Trail Mix Crackers has the better nutritional profile on the measures we compare. We compare Nutri-Score, processing level and seven nutrients per 100 g. Your own needs (for example low sugar or high protein) may make a different choice better for you.
Which has fewer calories?
Power up has fewer calories: 465 kcal versus 500 kcal per 100 g.
Which has less sugar?
Trail Mix Crackers has less sugar: 11.8 g versus 39.5 g per 100 g.