
Trail Mix vs Power up
Overall, Trail Mix has the better nutritional profile on the measures we compare. It wins on 4 of our comparison points versus 3.

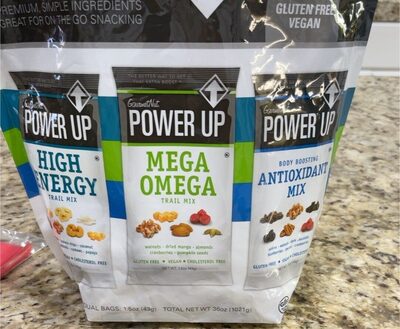
Nutrition per 100 g
| Nutrient | Trail Mix | Power up |
|---|---|---|
| Nutri-Score | d | d |
| NOVA group | 4 | 3 |
| Calories | 533 kcal | 465 kcal |
| Fat | 33.3 g | 23.3 g |
| Saturated fat | 6.7 g | 9.3 g |
| Sugars | 33.3 g | 39.5 g |
| Salt | 0.3 g | 0.2 g |
| Fiber | 6.7 g | 4.7 g |
| Protein | 16.7 g | 4.7 g |
| Additives | 10 | 1 |
| Allergens | Milk, Nuts, Peanuts, Soybeans | Nuts |
Green = better value for that nutrient (less sugar, fat, salt and calories; more fiber and protein).
Key differences
- Power up has 13% fewer calories (465 kcal vs 533 kcal).
- Power up has 30% less fat (23.3 g vs 33.3 g).
- Trail Mix has 28% less saturated fat (6.7 g vs 9.3 g).
- Trail Mix has 16% less sugar (33.3 g vs 39.5 g).
- Trail Mix has 30% more fiber (6.7 g vs 4.7 g).
- Trail Mix has 72% more protein (16.7 g vs 4.7 g).
- Power up is less processed (lower NOVA group).
- Only Trail Mix lists: Milk, Peanuts, Soybeans.
Ingredients
Trail Mix
Peanuts (Peanuts, peanut oil, salt), Raisins (Raisins, non-hydrogenated sunflower oil), Almonds (Almonds, canola oil, peanut oil, salt), Cashews (Cashews, peanut oil, salt), M&M's® Milk Chocolate Candies (Milk chocolate (sugar, chocolate, skim milk, cocoa butter, lactose, milkfat, soy lecithin, salt, artificial and natural flavors), sugar, cornstarch, 1% corn syrup, dextrin, coloring ( blue 1 lake, yellow 6, red 40, yellow 5, blue 1, yellow 6 lake, red 40 lake, yellow 5 lake, blue 2 lake, blue 2), carnauba wax, gum acacia.), M&M's Peanut Chocolate Candies (Milk chocolate (sugar, chocolate, skim milk, cocoa butter, lactose, milkfat, peanuts, soy lecithin, salt, artificial and natural flavors), sugar, peanuts, cornstarch, 1% palm oil, corn syrup, dextrin, coloring ( blue 1 lake, red 40, yellow 6, yellow 5, blue 1, red 40 lake, yellow 6 lake, yellow 5 lake, blue 2 lake, blue 2), carnauba wax, gum acacia.)
Power up
dried cranberries (cranberries, sugar, sunflower oil), dried mango (mango, sugar, citric acid) [product of thailand], roasted almonds (almonds, sunflower and/or canola oil), walnuts, pumpkin seeds [product of china), er contains: tree nuts (almonds, walnuts),
FAQ
Which is healthier: Trail Mix or Power up?
Overall, Trail Mix has the better nutritional profile on the measures we compare. We compare Nutri-Score, processing level and seven nutrients per 100 g. Your own needs (for example low sugar or high protein) may make a different choice better for you.
Which has fewer calories?
Power up has fewer calories: 465 kcal versus 533 kcal per 100 g.
Which has less sugar?
Trail Mix has less sugar: 33.3 g versus 39.5 g per 100 g.