
White Sourdough vs Battered Chunky Fish Fingers
Neither product is clearly better overall — it depends on what matters most to you.
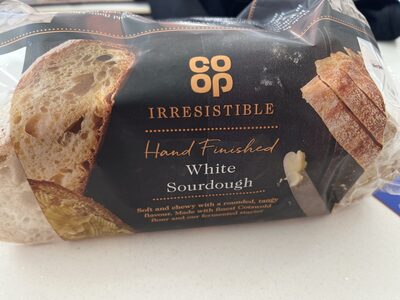
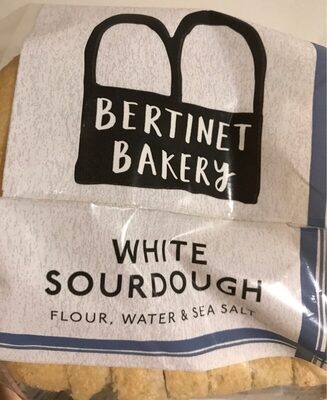
Nutrition per 100 g
| Nutrient | White Sourdough | Battered Chunky Fish Fingers |
|---|---|---|
| Nutri-Score | b | c |
| NOVA group | 3 | 3 |
| Calories | 260 kcal | 234 kcal |
| Fat | 2.7 g | 1.7 g |
| Saturated fat | 0.3 g | 0.3 g |
| Sugars | 2.7 g | 1.8 g |
| Salt | 0.8 g | 1.2 g |
| Fiber | 5.2 g | 3.2 g |
| Protein | 8 g | 9.1 g |
| Additives | 0 | 0 |
| Allergens | Gluten | Fish, Gluten |
Green = better value for that nutrient (less sugar, fat, salt and calories; more fiber and protein).
Key differences
- Battered Chunky Fish Fingers has 10% fewer calories (234 kcal vs 260 kcal).
- Battered Chunky Fish Fingers has 37% less fat (1.7 g vs 2.7 g).
- Battered Chunky Fish Fingers has 33% less sugar (1.8 g vs 2.7 g).
- White Sourdough has 33% less salt (0.8 g vs 1.2 g).
- White Sourdough has 38% more fiber (5.2 g vs 3.2 g).
- Battered Chunky Fish Fingers has 12% more protein (9.1 g vs 8 g).
- White Sourdough has the better Nutri-Score.
- Only Battered Chunky Fish Fingers lists: Fish.
Ingredients
White Sourdough
Wheat Flour (Wheat Flour, Calcium carbonate, Niacin, Iron, Thiamin), Water, Rapeseed Oil, Rice Flour, Rye Flour, Fermented Wheat Flour, Salt.
Battered Chunky Fish Fingers
Flour (Wheat Flour, Calcium, Iron, Niacin, Thiamine), Water, Wholemeal Wheat Flour, Barley Flour, Organic Wholemeal Emmer Wheat Flour, Spelt Flour (Wheat), Sea Salt. •No artificial preservatives • No added sugar N Ene Fat
FAQ
Which is healthier: White Sourdough or Battered Chunky Fish Fingers?
Neither product is clearly better overall — it depends on what matters most to you. We compare Nutri-Score, processing level and seven nutrients per 100 g. Your own needs (for example low sugar or high protein) may make a different choice better for you.
Which has fewer calories?
Battered Chunky Fish Fingers has fewer calories: 234 kcal versus 260 kcal per 100 g.
Which has less sugar?
Battered Chunky Fish Fingers has less sugar: 1.8 g versus 2.7 g per 100 g.