
Tapas de Queso vs Queso Manchego
Neither product is clearly better overall — it depends on what matters most to you.
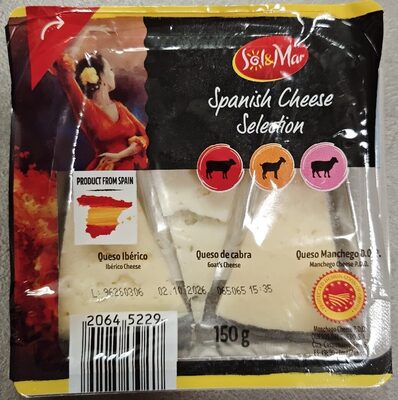
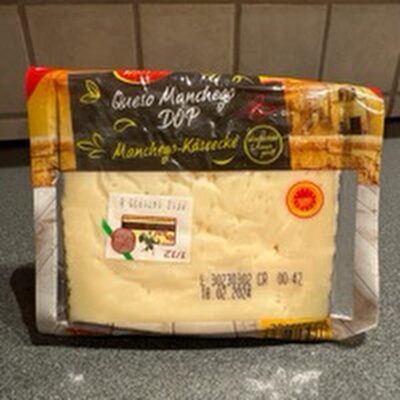
Nutrition per 100 g
| Nutrient | Tapas de Queso | Queso Manchego |
|---|---|---|
| Nutri-Score | d | d |
| NOVA group | 4 | 3 |
| Calories | 431 kcal | 455 kcal |
| Fat | 36 g | 38 g |
| Saturated fat | 24.3 g | 26.2 g |
| Sugars | 0.5 g | 1.3 g |
| Salt | 2.1 g | 2.1 g |
| Fiber | 0 g | — |
| Protein | 25.7 g | 27 g |
| Additives | 3 | 0 |
| Allergens | Milk | Milk, Ferments lactiques, Lait |
Green = better value for that nutrient (less sugar, fat, salt and calories; more fiber and protein).
Key differences
- Tapas de Queso has 62% less sugar (0.5 g vs 1.3 g).
- Queso Manchego is less processed (lower NOVA group).
- Only Queso Manchego lists: Ferments lactiques, Lait.
Ingredients
Tapas de Queso
queso manchego pdo ripened cheese (pasteurized sheep's milk, lactic ferments (contains milk), salt, coagulating enzyme of microbial origin, inedible rind containing preservatives (sorbic acid, natamycin) and colour (ordinary caramel)), mixed ripened cheese with sheep's, cow's and goat's milk (33% pasteurized sheep's milk, 32% pasteurized cow's milk, 20% pasteurized goat's milk, lactic ferments (contains milk), salt, coagulating enzyme of microbial origin, calcium chloride), cheese matured with goat's milk (pasteurized goat's milk, lactic ferments (contains milk), salt, coagulating enzyme of microbial origin, calcium chloride)
Queso Manchego
_lait_ de brebis pasteurisé, ferments lactiques, sel, présure
FAQ
Which is healthier: Tapas de Queso or Queso Manchego?
Neither product is clearly better overall — it depends on what matters most to you. We compare Nutri-Score, processing level and seven nutrients per 100 g. Your own needs (for example low sugar or high protein) may make a different choice better for you.
Which has fewer calories?
Tapas de Queso has fewer calories: 431 kcal versus 455 kcal per 100 g.
Which has less sugar?
Tapas de Queso has less sugar: 0.5 g versus 1.3 g per 100 g.