
Ocean Pie vs Classic Fish Pie
Neither product is clearly better overall — it depends on what matters most to you.

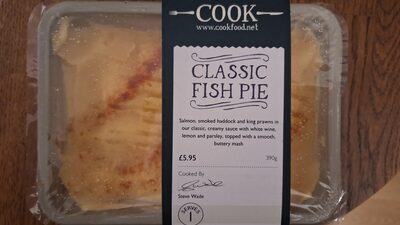
Nutrition per 100 g
| Nutrient | Ocean Pie | Classic Fish Pie |
|---|---|---|
| Nutri-Score | c | — |
| NOVA group | 1 | — |
| Calories | 109 kcal | 153 kcal |
| Fat | 4.7 g | 8.7 g |
| Saturated fat | 2.8 g | — |
| Sugars | 1.4 g | 1 g |
| Salt | 0.6 g | 0.4 g |
| Fiber | 0.7 g | 1.1 g |
| Protein | 6.9 g | 6.8 g |
| Additives | 0 | 0 |
| Allergens | Fish, Gluten, Milk | None listed |
Green = better value for that nutrient (less sugar, fat, salt and calories; more fiber and protein).
Key differences
- Ocean Pie has 29% fewer calories (109 kcal vs 153 kcal).
- Ocean Pie has 46% less fat (4.7 g vs 8.7 g).
- Classic Fish Pie has 29% less sugar (1 g vs 1.4 g).
- Classic Fish Pie has 36% more fiber (1.1 g vs 0.7 g).
- Only Ocean Pie lists: Fish, Gluten, Milk.
Ingredients
Ocean Pie
Potatoes (31%) - Haddock (Fish) (25%) Whole Milk. Taw Valley Cheddar Cheese (Milk) (7%). Onions Butter (Milk) Whipping Cream (Milk) Cornflour. Dried Potatoes Parsley Salt Wheatflour contains Gluten (with Wheatflour, Calcium Carbonate, Iron, Niacin, Thiamin) Potato Starch Ground White Pepper.
Classic Fish Pie
Not available.
FAQ
Which is healthier: Ocean Pie or Classic Fish Pie?
Neither product is clearly better overall — it depends on what matters most to you. We compare Nutri-Score, processing level and seven nutrients per 100 g. Your own needs (for example low sugar or high protein) may make a different choice better for you.
Which has fewer calories?
Ocean Pie has fewer calories: 109 kcal versus 153 kcal per 100 g.
Which has less sugar?
Classic Fish Pie has less sugar: 1 g versus 1.4 g per 100 g.