
Hobnobs vs Bjärla OAT Biscuits
Overall, Hobnobs has the better nutritional profile on the measures we compare. It wins on 3 of our comparison points versus 0.
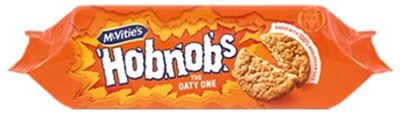
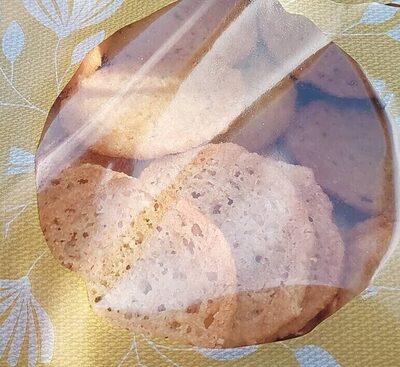
Nutrition per 100 g
| Nutrient | Hobnobs | Bjärla OAT Biscuits |
|---|---|---|
| Nutri-Score | e | e |
| NOVA group | 4 | 4 |
| Calories | 472 kcal | 482 kcal |
| Fat | 20.2 g | 22 g |
| Saturated fat | 8.8 g | 9.5 g |
| Sugars | 22.9 g | 40 g |
| Salt | 0.8 g | 1.2 g |
| Fiber | 6.5 g | — |
| Protein | 7.4 g | 5.2 g |
| Additives | 4 | 4 |
| Allergens | Gluten | Gluten |
Green = better value for that nutrient (less sugar, fat, salt and calories; more fiber and protein).
Key differences
- Hobnobs has 43% less sugar (22.9 g vs 40 g).
- Hobnobs has 32% less salt (0.8 g vs 1.2 g).
- Hobnobs has 30% more protein (7.4 g vs 5.2 g).
Ingredients
Hobnobs
Wholegrain Rolled Oats (39%), Wholemeal Wheat Flour (23%), Palm Oil, Sugar, Partially Inverted Sugar Syrup, Raising Agents (Sodium Bicarbonate, Ammonium Bicarbonate), Salt.
Bjärla OAT Biscuits
Sucre, flocons d'avoine (23 %), farine de blé, matières grasses végétales (palme, palmiste), huile de colza, sel, poudres à lever (E503, E450, E500), émulsifiant (E471), arôme. Peut contenir des œufs et des amandes.
FAQ
Which is healthier: Hobnobs or Bjärla OAT Biscuits?
Overall, Hobnobs has the better nutritional profile on the measures we compare. We compare Nutri-Score, processing level and seven nutrients per 100 g. Your own needs (for example low sugar or high protein) may make a different choice better for you.
Which has fewer calories?
Hobnobs has fewer calories: 472 kcal versus 482 kcal per 100 g.
Which has less sugar?
Hobnobs has less sugar: 22.9 g versus 40 g per 100 g.