
Comparison
Choux de Bruxelles vs Rosenkohl TK
Overall, Rosenkohl TK has the better nutritional profile on the measures we compare. It wins on 2 of our comparison points versus 1.
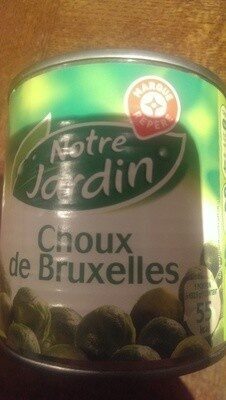
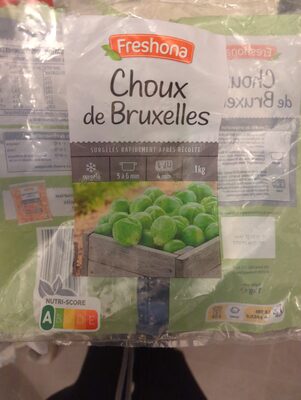
Nutrition per 100 g
| Nutrient | Choux de Bruxelles | Rosenkohl TK |
|---|---|---|
| Nutri-Score | a | a |
| NOVA group | 3 | — |
| Calories | 39 kcal | 42 kcal |
| Fat | 0.5 g | 1.3 g |
| Saturated fat | 0.1 g | 0.3 g |
| Sugars | 2.8 g | 3 g |
| Salt | 0.5 g | 0 g |
| Fiber | 2.9 g | 2.6 g |
| Protein | 2.5 g | 2.9 g |
| Additives | 0 | 0 |
| Allergens | None listed | None listed |
Green = better value for that nutrient (less sugar, fat, salt and calories; more fiber and protein).
Key differences
- Choux de Bruxelles has 62% less fat (0.5 g vs 1.3 g).
- Rosenkohl TK has 98% less salt (0 g vs 0.5 g).
- Rosenkohl TK has 14% more protein (2.9 g vs 2.5 g).
Ingredients
Choux de Bruxelles
Choux de Bruxelles, eau, sel.
Rosenkohl TK
Not available.
FAQ
Which is healthier: Choux de Bruxelles or Rosenkohl TK?
Overall, Rosenkohl TK has the better nutritional profile on the measures we compare. We compare Nutri-Score, processing level and seven nutrients per 100 g. Your own needs (for example low sugar or high protein) may make a different choice better for you.
Which has fewer calories?
Choux de Bruxelles has fewer calories: 39 kcal versus 42 kcal per 100 g.
Which has less sugar?
Choux de Bruxelles has less sugar: 2.8 g versus 3 g per 100 g.
More comparisons
Choux de Bruxelles vs Rosenkohl TK
Choux de Bruxelles minut... vs Rosenkohl TK
Choux de bruxelles crème... vs Choux de Bruxelles
Choux de bruxelles crème... vs Rosenkohl TK
Choux de Bruxelles vs Rosenkohl TK
Choux de Bruxelles vs Choux de Bruxelles
Choux de Bruxelles vs Choux de Bruxelles
Choux de Bruxelles vs Choux de Bruxelles