
Nesquik vs Nestle Milo
Neither product is clearly better overall — it depends on what matters most to you.
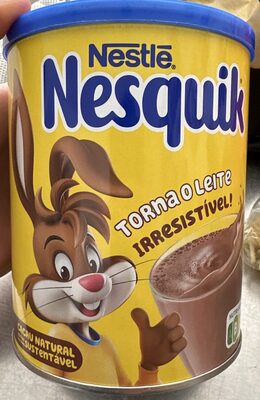
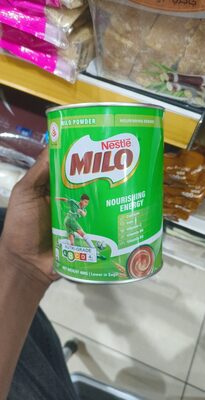
Nutrition per 100 g
| Nutrient | Nesquik | Nestle Milo |
|---|---|---|
| Nutri-Score | — | — |
| NOVA group | 4 | 3 |
| Calories | 386 kcal | 410 kcal |
| Fat | 3.6 g | 10 g |
| Saturated fat | 1.6 g | 5 g |
| Sugars | 75.1 g | 40 g |
| Salt | 0.4 g | 0.4 g |
| Fiber | 7.7 g | 4.3 g |
| Protein | 5.1 g | 11.7 g |
| Additives | 0 | 3 |
| Allergens | Soybeans | Gluten, Milk |
Green = better value for that nutrient (less sugar, fat, salt and calories; more fiber and protein).
Key differences
- Nesquik has 64% less fat (3.6 g vs 10 g).
- Nesquik has 68% less saturated fat (1.6 g vs 5 g).
- Nestle Milo has 47% less sugar (40 g vs 75.1 g).
- Nesquik has 44% more fiber (7.7 g vs 4.3 g).
- Nestle Milo has 56% more protein (11.7 g vs 5.1 g).
- Nestle Milo is less processed (lower NOVA group).
- Only Nesquik lists: Soybeans.
- Only Nestle Milo lists: Gluten, Milk.
Ingredients
Nesquik
Açúcar, cacau magro em pó (23%), emulsionante (lecitina de _soja_), sal, vitaminas (C, D), aroma natural e canela.
Nestle Milo
protomalt malt extract (contains barley), skimmed milk (cow's milk), sugar, cocoa, palm oil, minerals (dicalcium phosphate, disodium phosphate, ferric pyrophosphate), vitamins (c, b3, d, b6, b2, b12), vanillin,
FAQ
Which is healthier: Nesquik or Nestle Milo?
Neither product is clearly better overall — it depends on what matters most to you. We compare Nutri-Score, processing level and seven nutrients per 100 g. Your own needs (for example low sugar or high protein) may make a different choice better for you.
Which has fewer calories?
Nesquik has fewer calories: 386 kcal versus 410 kcal per 100 g.
Which has less sugar?
Nestle Milo has less sugar: 40 g versus 75.1 g per 100 g.