
Complete Buttermilk Pancake & Waffle Mix vs Power Cakes Flapjack & Waffle Mix
Overall, Power Cakes Flapjack & Waffle Mix has the better nutritional profile on the measures we compare. It wins on 6 of our comparison points versus 1.
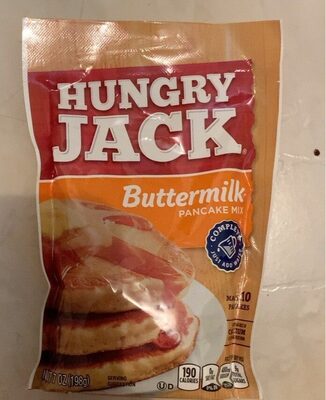
Complete Buttermilk Pancake & Waffle Mix
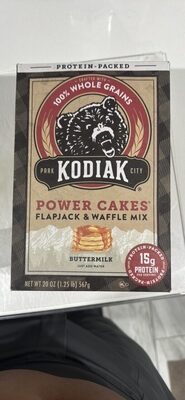
Power Cakes Flapjack & Waffle Mix
Nutrition per 100 g
| Nutrient | Complete Buttermilk Pancake... | Power Cakes Flapjack & Waffl... |
|---|---|---|
| Nutri-Score | e | a |
| NOVA group | 4 | — |
| Calories | 342 kcal | 349 kcal |
| Fat | 2 g | 4 g |
| Saturated fat | 0.5 g | 0.8 g |
| Sugars | 16 g | 6.4 g |
| Salt | 3.3 g | 0 g |
| Fiber | 2 g | 7.9 g |
| Protein | 7 g | 23.8 g |
| Additives | 3 | 4 |
| Allergens | Gluten, Milk | Gluten, Milk |
Green = better value for that nutrient (less sugar, fat, salt and calories; more fiber and protein).
Key differences
- Complete Buttermilk Pancake & Waffle Mix has 50% less fat (2 g vs 4 g).
- Power Cakes Flapjack & Waffle Mix has 60% less sugar (6.4 g vs 16 g).
- Power Cakes Flapjack & Waffle Mix has no salt, while Complete Buttermilk Pancake & Waffle Mix has 3.3 g.
- Power Cakes Flapjack & Waffle Mix has 75% more fiber (7.9 g vs 2 g).
- Power Cakes Flapjack & Waffle Mix has 71% more protein (23.8 g vs 7 g).
- Power Cakes Flapjack & Waffle Mix has the better Nutri-Score.
Ingredients
Complete Buttermilk Pancake & Waffle Mix
Harina de trigo blanqueada, azúcar, levadura (bicarbonato de sodio, fosfato de aluminio y sodio, fosfato de calcio), dextrosa, dextrosa de maíz, sal, aceite de canola y/o soya, emulsionante de maíz, contiene 2% o menos de: leche deshidratada, almidón de maíz, cebada malteada.
Power Cakes Flapjack & Waffle Mix
KODIAK PARK CITY FLAPJACK AND WAFFLE MIX BUTTERMILK For optimal freshness, store in a cool, dry place. Nutrition Facts 9 servings per container Serving size 1/2 cup (63g) Makes about three, 4" flapjacks Amount Per Serving Calories 220 LS 9% CLOROX % Daily Value* Total Fat 2.5g 3% Saturated Fat 0.5g 3% Trans Fat 0g Cholesterol 10mg 3% Sodium 450mg 20% Total Carbohydrate 37g 13% Dietary Fiber 5g 18% Total Sugars 4g Includes 3g Added Sugars 6% Protein 15g 17% Vitamin D 0mcg 0% Calcium 250mg 20% Iron 2.1mg 10% Potassium 210mg 4% "The % Daily Value (DV) tells you how much a nutrient in a serving of food contributes to a daily diet. 2,000 calories a day is used for general nutrition advice. INGREDIENTS: 100% whole grain wheat flour, 100% whole grain oat flour, vital wheat gluten, whey protein concentrate, brown sugar, wheat protein isolate, milk protein concentrate, leavening (monocalcium phosphate, baking soda), buttermilk, sea salt. Contains milk and wheat. CREATED & DISTRIBUTED BY Bathroom DISINFECTING CLEANER powers through soap scum tough bathroom sof
FAQ
Which is healthier: Complete Buttermilk Pancake & Waffle Mix or Power Cakes Flapjack & Waffle Mix?
Overall, Power Cakes Flapjack & Waffle Mix has the better nutritional profile on the measures we compare. We compare Nutri-Score, processing level and seven nutrients per 100 g. Your own needs (for example low sugar or high protein) may make a different choice better for you.
Which has fewer calories?
Complete Buttermilk Pancake & Waffle Mix has fewer calories: 342 kcal versus 349 kcal per 100 g.
Which has less sugar?
Power Cakes Flapjack & Waffle Mix has less sugar: 6.4 g versus 16 g per 100 g.