Top 10 · Updated October 2026

Highest-Protein Mix Of Cereals And Legumes

Mix of cereals and legumes: typically 14 g of protein per 100 g (median of 74 products). The mix of cereals and legumes with the most protein per 100 g. Useful if you are trying to increase your protein intake. We checked 73 mix of cereals and legumes with complete data.

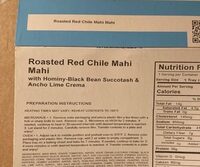
  1. 1 Roasted red Chile Mahi mahi

    Roasted red Chile Mahi mahi

    Factor · 369 g
    d 460 kcal 8 g sugar 39 g protein 14 g fat

    Also: No additives

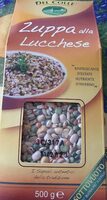
  2. 2 Mix Legume

    Mix Legume

    Del Colle · 500g
    a 347 kcal 2.8 g sugar 25.5 g protein 2 g fat
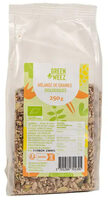
  3. 3 Mix graines tournesol courge lin sésame

    Mix graines tournesol courge lin sésame

    Greenweez · 250 g
    a NOVA 1 573 kcal 1.5 g sugar 23.3 g protein 47.3 g fat

    Also: Palm oil free · Vegan · Vegetarian

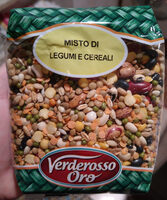
  4. 4 Misto di legumi e cereali

    Misto di legumi e cereali

    Maxi dì · 500 g
    a NOVA 1 328 kcal 2.5 g sugar 21.3 g protein 14 g fat

    Also: Palm oil free · No additives

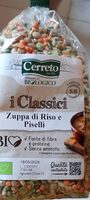
  5. 5 Zuppa di Riso e Piselli

    Zuppa di Riso e Piselli

    Cerreto
    a 342 kcal 1.6 g sugar 21.3 g protein 1.8 g fat
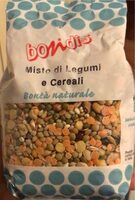
  6. 6 Misto di Legumi e Cereali

    Misto di Legumi e Cereali

    Bondis
    328 kcal 2.5 g sugar 21.3 g protein 1.4 g fat
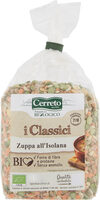
  7. 7 I classici zuppa all'isolana bio

    I classici zuppa all'isolana bio

    Cerreto
    349 kcal 0.3 g sugar 21.1 g protein 1.9 g fat
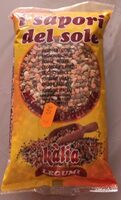
  8. 8 Legumi

    Legumi

    Kalia
    a NOVA 1 299 kcal 4.2 g sugar 21 g protein 4.8 g fat

    Also: No additives

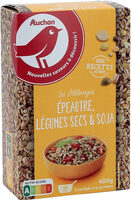
  9. 9 Epeautre, légumes secs, soja

    Epeautre, légumes secs, soja

    AUCHAN · 0.4 kg
    a NOVA 1 362 kcal 1.4 g sugar 20 g protein 4.7 g fat

    Also: Palm oil free · No additives

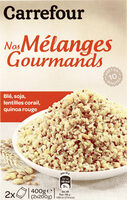
  10. 10 Blé et lentilles soja et Quinoa

    Blé et lentilles soja et Quinoa

    Carrefour · 200g
    a NOVA 3 360 kcal 1.5 g sugar 19 g protein 5.5 g fat

    Also: Palm oil free · Vegan · Vegetarian

How we built this list

We ranked all published mix of cereals and legumes on Foodmetria that have a photo and the required nutrition data, using values per 100 g from the product label. Ties are broken by Nutri-Score and by how often shoppers scan the product. Rankings update automatically as label data changes. Read our methodology.

More mix of cereals and legumes rankings