
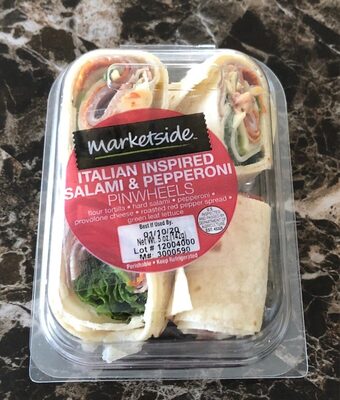
View full-size photo · Photo: Open Food Facts contributors, CC BY-SA
Italian inspired salami & pepperoni pinwheels
Italian inspired salami & pepperoni pinwheels by Marketside provides 433 kcal per 100 g, with 3.6 g of sugars and 35.5 g of protein. Its Nutri-Score is B. It is listed in the Sandwiches category.
Nutrient levels per 100 g
Levels use UK front-of-pack reference thresholds.
Nutrition facts
| Nutrient | Per 100 g | Category avg |
|---|---|---|
| Calories | 433 kcal | 284 +52% |
| Total fat | 8.5 g | 15.6 −45% |
| Saturated fat | 2.8 g | 5.2 −45% |
| Carbohydrates | 28.4 g | 25.4 +12% |
| Total sugars | 3.6 g | 3.9 −8% |
| Protein | 35.5 g | 15.5 +128% |
| Salt | 0 g | 2 −99% |
*% Daily Value for 100 g, based on a 2,000-calorie diet (FDA reference values). Category average across 6537 Sandwiches products on Foodmetria.
Nutrition claims check
Claims its numbers support
- High protein
- 33% of calories from protein (EU: at least 20% of calories from protein)
- Low sugar
- 3.6 g sugars per 100 g (EU: no more than 5 g per 100 g)
- Sodium-free
- 4 mg sodium per 100 g (EU: no more than 5 mg per 100 g)
Checked against the per-100 g thresholds of EU Regulation 1924/2006, using the nutrition data above. US labels follow FDA rules, which are mostly based on serving size and can give a different result; FDA has no defined “low sugar” claim.
Compared with other sandwiches
Bar shows the share of products in this category that contain less of the nutrient.
Product details
- Sold in
- United States
- Barcode
- 0681131081658
Prices reported by shoppers
Loading prices…
Frequently asked questions
How many calories are in Italian inspired salami & pepperoni pinwheels?
Italian inspired salami & pepperoni pinwheels contains 433 kcal per 100 g.
How much sugar is in Italian inspired salami & pepperoni pinwheels?
Italian inspired salami & pepperoni pinwheels has 3.6 g of sugars per 100 g, which is considered low by UK front-of-pack guidelines.
Is Italian inspired salami & pepperoni pinwheels healthy?
It has a Nutri-Score of B (A is best, E is worst). Scores describe nutritional quality and processing, not suitability for your individual diet.
Source: Open Food Facts (ODbL). Last updated May 1, 2020. Spotted a mistake? Edit this product on Open Food Facts. Not medical advice — always check the package label.
Reviews
Compare & rankings
Healthier alternatives
Best in category →Same category, meaningfully better on at least one measure and no worse on the others. Each card shows what improves.
More sandwiches
View all → c NOVA 4
 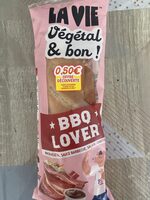 c NOVA 4
 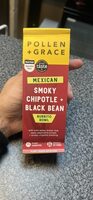 a NOVA 3
 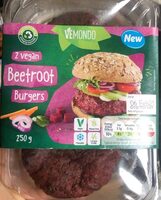 a NOVA 3
 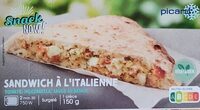 c NOVA 3
  c
c More from Marketside
View all → a NOVA 1
  NOVA 1
  c NOVA 4
  c
c  c NOVA 1
  b NOVA 3