
Strawberry preserves vs Fit & Well Fraises
Overall, Fit & Well Fraises has the better nutritional profile on the measures we compare. It wins on 6 of our comparison points versus 0.
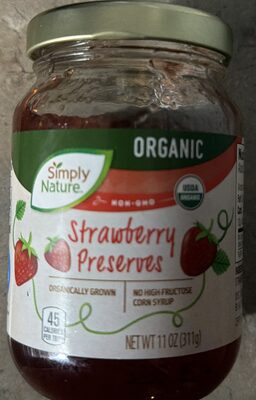
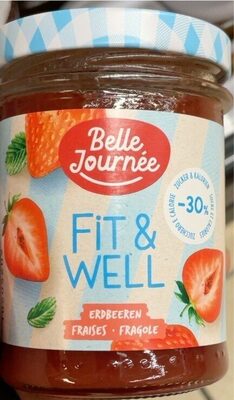
Nutrition per 100 g
| Nutrient | Strawberry preserves | Fit & Well Fraises |
|---|---|---|
| Nutri-Score | d | c |
| NOVA group | 4 | 4 |
| Calories | 225 kcal | 142 kcal |
| Fat | 0 g | 0 g |
| Saturated fat | 0 g | 0 g |
| Sugars | 60 g | 34 g |
| Salt | 0 g | 0 g |
| Fiber | 0 g | 1.5 g |
| Protein | 0 g | 0.8 g |
| Additives | 2 | 4 |
| Allergens | None listed | None listed |
Green = better value for that nutrient (less sugar, fat, salt and calories; more fiber and protein).
Key differences
- Fit & Well Fraises has 37% fewer calories (142 kcal vs 225 kcal).
- Fit & Well Fraises has 43% less sugar (34 g vs 60 g).
- Fit & Well Fraises has 100% more fiber (1.5 g vs 0 g).
- Fit & Well Fraises has 100% more protein (0.8 g vs 0 g).
- Fit & Well Fraises has the better Nutri-Score.
Ingredients
Strawberry preserves
organic sugar, organic strawberries, citric acid, fruit pectin
Fit & Well Fraises
Fraises 60%, fructose, eau, gélifiant: pectine, acidifiant: acide citrique, conservateur: sorbate de potassium, antioxydant: acide ascorbique.
FAQ
Which is healthier: Strawberry preserves or Fit & Well Fraises?
Overall, Fit & Well Fraises has the better nutritional profile on the measures we compare. We compare Nutri-Score, processing level and seven nutrients per 100 g. Your own needs (for example low sugar or high protein) may make a different choice better for you.
Which has fewer calories?
Fit & Well Fraises has fewer calories: 142 kcal versus 225 kcal per 100 g.
Which has less sugar?
Fit & Well Fraises has less sugar: 34 g versus 60 g per 100 g.