
Oz Miel vs Miel pops loops
Overall, Oz Miel has the better nutritional profile on the measures we compare. It wins on 3 of our comparison points versus 2.
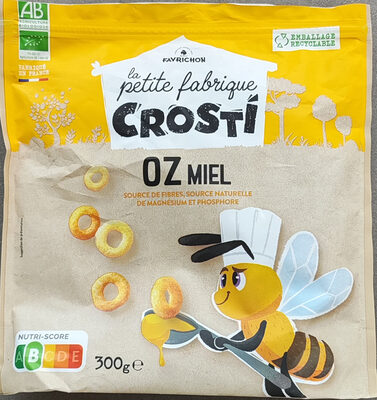
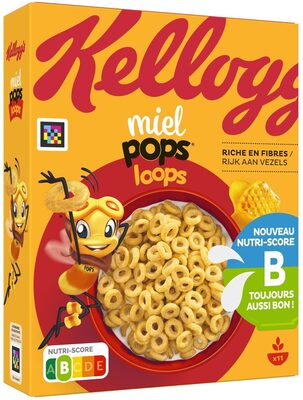
Nutrition per 100 g
| Nutrient | Oz Miel | Miel pops loops |
|---|---|---|
| Nutri-Score | c | c |
| NOVA group | 3 | 4 |
| Calories | 381 kcal | 396 kcal |
| Fat | 1.8 g | 4.4 g |
| Saturated fat | 0.5 g | 0.7 g |
| Sugars | 20 g | 22 g |
| Salt | 0.3 g | 0.6 g |
| Fiber | 4.9 g | 7.5 g |
| Protein | 6.6 g | 9.3 g |
| Additives | 0 | 2 |
| Allergens | Gluten, Sucre de canne | Gluten |
Green = better value for that nutrient (less sugar, fat, salt and calories; more fiber and protein).
Key differences
- Oz Miel has 59% less fat (1.8 g vs 4.4 g).
- Oz Miel has 53% less salt (0.3 g vs 0.6 g).
- Miel pops loops has 35% more fiber (7.5 g vs 4.9 g).
- Miel pops loops has 29% more protein (9.3 g vs 6.6 g).
- Oz Miel is less processed (lower NOVA group).
- Only Oz Miel lists: Sucre de canne.
Ingredients
Oz Miel
Céréales* (riz* complet 47,1%, orge* complète 16,8%, maïs* 16,8%), sucre de canne* non raffiné, miel* 7 %, caramel* (_sucre de canne_*, eau), sel de mer. *Ingrédients issus de l'agriculture biologique. Souligné: ingrédients issus du commerce équitable.
Miel pops loops
Farines de céréales complètes (83%) (blé, avoine, orge, seigle), sucre, miel (4.5%), sel, sirop de glucose, phosphate tricalcique, arôme naturel, antioxydant (extrait riche en tocophérols), colorant (caroténoïdes), niacine, fer, vitamine B6, riboflavine, thiamine, acide folique, vitamine D, vitamine B12.
FAQ
Which is healthier: Oz Miel or Miel pops loops?
Overall, Oz Miel has the better nutritional profile on the measures we compare. We compare Nutri-Score, processing level and seven nutrients per 100 g. Your own needs (for example low sugar or high protein) may make a different choice better for you.
Which has fewer calories?
Oz Miel has fewer calories: 381 kcal versus 396 kcal per 100 g.
Which has less sugar?
Oz Miel has less sugar: 20 g versus 22 g per 100 g.