
Excellence 85% cacao vs Lindt
Overall, Lindt has the better nutritional profile on the measures we compare. It wins on 6 of our comparison points versus 2.
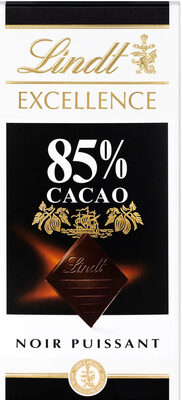
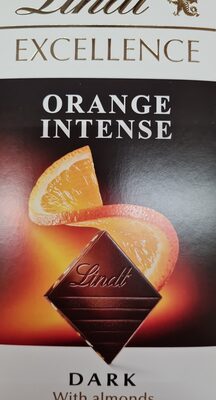
Nutrition per 100 g
| Nutrient | Excellence 85% cacao | Lindt |
|---|---|---|
| Nutri-Score | e | d |
| NOVA group | 3 | 4 |
| Calories | 584 kcal | 535 kcal |
| Fat | 46 g | 32 g |
| Saturated fat | 27 g | 3.6 g |
| Sugars | 15 g | 9.7 g |
| Salt | 0 g | 0 g |
| Fiber | 0 g | 2.5 g |
| Protein | 12.5 g | 7 g |
| Additives | 0 | 3 |
| Allergens | None listed | Milk, Nuts, Soybeans |
Green = better value for that nutrient (less sugar, fat, salt and calories; more fiber and protein).
Key differences
- Lindt has 30% less fat (32 g vs 46 g).
- Lindt has 87% less saturated fat (3.6 g vs 27 g).
- Lindt has 35% less sugar (9.7 g vs 15 g).
- Lindt has 100% more fiber (2.5 g vs 0 g).
- Excellence 85% cacao has 44% more protein (12.5 g vs 7 g).
- Lindt has the better Nutri-Score.
- Excellence 85% cacao is less processed (lower NOVA group).
- Only Lindt lists: Milk, Nuts, Soybeans.
Ingredients
Excellence 85% cacao
Pâte de cacao, cacao maigre, beurre de cacao, cassonade, vanille. Peut contenir du lait, des fruits à coque, du soja et des graines de sésame. 3 046920 022606
Lindt
sugar, cocoa mass, almonds 7%, orange juice from concentrate 3,9%, cocoa butter, anhydrous milk fat, invert sugar, lemon juice from concentrate, emulsifier (soya lecithin), pineapple, gelling agent (pectin), natural orange flavouring
FAQ
Which is healthier: Excellence 85% cacao or Lindt?
Overall, Lindt has the better nutritional profile on the measures we compare. We compare Nutri-Score, processing level and seven nutrients per 100 g. Your own needs (for example low sugar or high protein) may make a different choice better for you.
Which has fewer calories?
Lindt has fewer calories: 535 kcal versus 584 kcal per 100 g.
Which has less sugar?
Lindt has less sugar: 9.7 g versus 15 g per 100 g.