
Mars vs Snickers
Overall, Snickers has the better nutritional profile on the measures we compare. It wins on 2 of our comparison points versus 1.
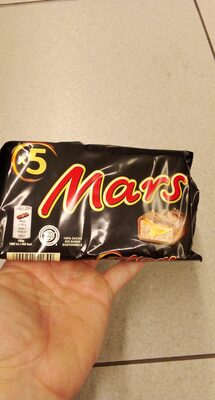
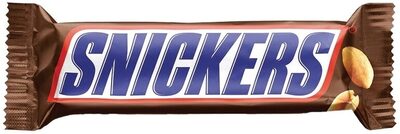
Nutrition per 100 g
| Nutrient | Mars | Snickers |
|---|---|---|
| Nutri-Score | e | e |
| NOVA group | 4 | 4 |
| Calories | 442 kcal | 489 kcal |
| Fat | 16 g | 23 g |
| Saturated fat | 7.5 g | 7.6 g |
| Sugars | 61 g | 51 g |
| Salt | 0.7 g | 0.5 g |
| Fiber | — | 3.2 g |
| Protein | 4.5 g | 8.6 g |
| Additives | 2 | 2 |
| Allergens | Eggs, Gluten, Milk, Soybeans, Lait, Lécithine de soja, Malt d’orge | Eggs, Milk, Nuts, Peanuts, Soybeans |
Green = better value for that nutrient (less sugar, fat, salt and calories; more fiber and protein).
Key differences
- Mars has 30% less fat (16 g vs 23 g).
- Snickers has 16% less sugar (51 g vs 61 g).
- Snickers has 48% more protein (8.6 g vs 4.5 g).
- Only Mars lists: Gluten, Lait, Lécithine de soja, Malt d’orge.
- Only Snickers lists: Nuts, Peanuts.
Ingredients
Mars
Sucre, sirop de glucose, lait écrémé en poudre, beurre de cacao, pâte de cacao, huile de tournesol, pérméat de lactosérum (lait), matière gras de palme, matière gras de lait, cacao maigre en poudre, extrait de malt d’orge, sel, émulsifiant (lécithine de soja), blanc d’œuf en poudre
Snickers
milk chocolate (sugar, cocoa butter, chocolate, skim milk, lactose, milkfat, soy lecithin), peanuts, corn syrup, sugar, palm oil, skim milk, lactose, salt, egg whites, artificial flavor, peanuts, milk, egg and soy, tree nuts,
FAQ
Which is healthier: Mars or Snickers?
Overall, Snickers has the better nutritional profile on the measures we compare. We compare Nutri-Score, processing level and seven nutrients per 100 g. Your own needs (for example low sugar or high protein) may make a different choice better for you.
Which has fewer calories?
Mars has fewer calories: 442 kcal versus 489 kcal per 100 g.
Which has less sugar?
Snickers has less sugar: 51 g versus 61 g per 100 g.