
Tarte A La Fraise vs Mince Pies
Overall, Tarte A La Fraise has the better nutritional profile on the measures we compare. It wins on 3 of our comparison points versus 2.
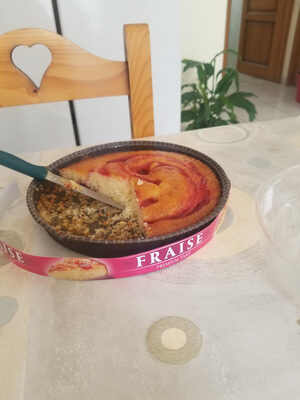
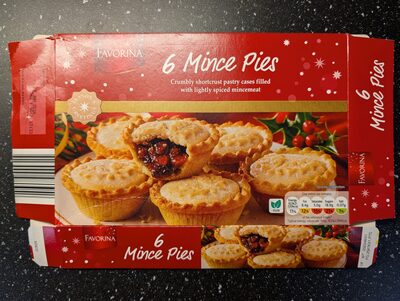
Nutrition per 100 g
| Nutrient | Tarte A La Fraise | Mince Pies |
|---|---|---|
| Nutri-Score | d | d |
| NOVA group | — | 4 |
| Calories | 348 kcal | 384 kcal |
| Fat | 21 g | 14.7 g |
| Saturated fat | 2.8 g | 5.2 g |
| Sugars | 21 g | 33 g |
| Salt | 0.4 g | 0.1 g |
| Fiber | — | 3.5 g |
| Protein | 4 g | 3.3 g |
| Additives | 0 | 9 |
| Allergens | None listed | Gluten, Sulphur dioxide and sulphites |
Green = better value for that nutrient (less sugar, fat, salt and calories; more fiber and protein).
Key differences
- Mince Pies has 30% less fat (14.7 g vs 21 g).
- Tarte A La Fraise has 47% less saturated fat (2.8 g vs 5.2 g).
- Tarte A La Fraise has 36% less sugar (21 g vs 33 g).
- Mince Pies has 73% less salt (0.1 g vs 0.4 g).
- Tarte A La Fraise has 17% more protein (4 g vs 3.3 g).
- Only Mince Pies lists: Gluten, Sulphur dioxide and sulphites.
Ingredients
Tarte A La Fraise
Not available.
Mince Pies
49% Mincemeat Filling (Sugar, Bramley Apple Purée, 16% Raisins, Glucose Syrup, 8% Sultanas, Apricot Filling [Glucose-Fructose Syrup, Apricot Purée, Sugar, Gelling Agent: Pectins; Acid: Citric Acid; Acidity Regulator: Sodium Citrates; Preservative: Potassium Sorbate], 3.5% Currants, Candied Mixed Peel [Orange Peel, Glucose-Fructose Syrup, Lemon Peel, Sugar, Acidity Regulator: Citric Acid; Preservative: Sulphur Dioxide], Vegetable Oils [Palm, Rapeseed], Ground Mixed Spices [Cinnamon, Coriander, Dill, Ginger, Nutmeg, Cloves], Acids: Acetic Acid, Citric Acid; Roasted Barley Malt Extract, Preservatives: Potassium Sorbate, Sodium Metabisulphite, Sulphur Dioxide; Flavouring), Wheat Flour (Wheat Flour, Calcium Carbonate, Iron, Niacin, Thiamin), Vegetable Oils (Palm, Rapeseed), Glucose Syrup, Sugar, Dextrose, Salt, Raising Agents: Diphosphates, Sodium Carbonates; Preservative: Potassium Sorbate.
FAQ
Which is healthier: Tarte A La Fraise or Mince Pies?
Overall, Tarte A La Fraise has the better nutritional profile on the measures we compare. We compare Nutri-Score, processing level and seven nutrients per 100 g. Your own needs (for example low sugar or high protein) may make a different choice better for you.
Which has fewer calories?
Tarte A La Fraise has fewer calories: 348 kcal versus 384 kcal per 100 g.
Which has less sugar?
Tarte A La Fraise has less sugar: 21 g versus 33 g per 100 g.