Top 10 · Updated November 2026

Least Processed Brownies Mixes

1 of the top 10 brownies mixes products sit in NOVA group 3 — the least processed end of the scale. The brownies mixes with the lowest NOVA processing group — fewer industrial ingredients and additives. We checked 24 brownies mixes with complete data.

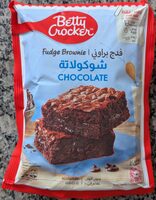
  1. 1 Chocolate Fudge Brownie Mix

    Chocolate Fudge Brownie Mix

    Betty Crocker · 250g
    NOVA 3 437 kcal 60 g sugar 4.4 g protein 5.4 g fat

    Also: Vegetarian · No additives

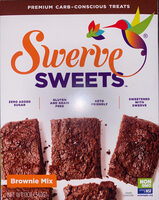
  2. 2 Brownie Mix

    Brownie Mix

    Swerve · 12 oz
    d NOVA 4 321 kcal 3.6 g sugar 10.7 g protein 21.4 g fat

    Also: Palm oil free

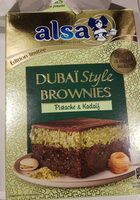
  3. 3 Brownies Dubai style

    Brownies Dubai style

    Alsa · 260 g
    e NOVA 4 514 kcal 38 g sugar 6.3 g protein 33 g fat
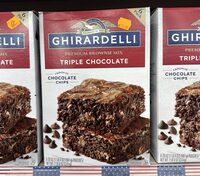
  4. 4 Triple Chocolate

    Triple Chocolate

    Ghirardelli · 6 x 20 oz (1 lb 4 oz) 567 g pouches / 7 lb 8 oz (3.4 kg)
    e NOVA 4 563 kcal 56.3 g sugar 6.3 g protein 21.9 g fat

    Also: Palm oil free

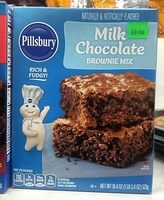
  5. 5 Milk Chocolate Brownie Mix

    Milk Chocolate Brownie Mix

    Pillsbury · 18.4 oz (1 lb 2.4 oz) 521 g
    e NOVA 4 621 kcal 58.6 g sugar 6.9 g protein 31 g fat

    Also: Palm oil free

  6. 6 Brownies Langpanne

    Brownies Langpanne

    Lantmännen cerealia · 850g
    e NOVA 4 425 kcal 50 g sugar 5.3 g protein 16 g fat

    Also: Palm oil free

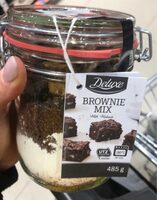
  7. 7 Brownie Mix

    Brownie Mix

    Deluxe · 485 g
    NOVA 4 418 kcal 26.6 g sugar 6.6 g protein 22.7 g fat

    Also: Palm oil free

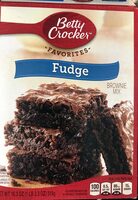
  8. 8 Fudge Brownie Mix

    Fudge Brownie Mix

    Betty Crocker · 18.3 oz (1 lb 2.3 oz) 519 g
    NOVA 4 414 kcal 58.6 g sugar 3.5 g protein 3.5 g fat

    Also: No additives

  9. 9 Fudge brownie

    Fudge brownie

    Betty Crocker · 16.3 oz
    NOVA 4 344 kcal 59.1 g sugar 4.2 g protein 9.2 g fat

    Also: No additives

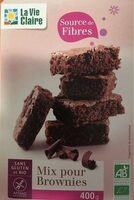
  10. 10 Mix pour brownies

    Mix pour brownies

    La vie claire
    NOVA 4 410 kcal 55 g sugar 4.2 g protein 4.8 g fat

    Also: Palm oil free

How we built this list

We ranked all published brownies mixes on Foodmetria that have a photo and the required nutrition data, using values per 100 g from the product label. Ties are broken by Nutri-Score and by how often shoppers scan the product. Rankings update automatically as label data changes. Read our methodology.

More brownies mixes rankings