
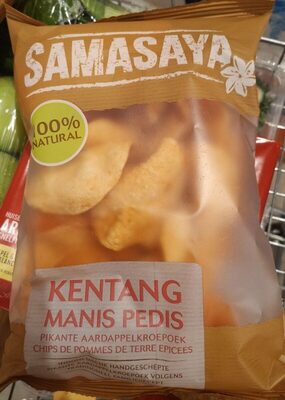
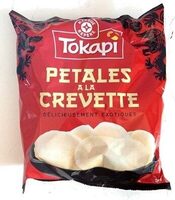
View full-size photo · Photo: Open Food Facts contributors, CC BY-SA
Kentang manis pedis
Kentang manis pedis provides 375 kcal per 100 g, with 3.5 g of sugars and 1.5 g of protein. That is 54% less sugar than the average product in this category. Its Nutri-Score is C. It is listed in the Prawn crackers category.
Nutrient levels per 100 g
Levels use UK front-of-pack reference thresholds.
Nutrition facts
| Nutrient | Per 100 g | Category avg |
|---|---|---|
| Calories | 375 kcal | 486 −23% |
| Total fat | 9.4 g | 25.2 −63% |
| Saturated fat | 0.9 g | 2.8 −68% |
| Carbohydrates | 70.2 g | 62.7 +12% |
| Total sugars | 3.5 g | 7.7 −54% |
| Protein | 1.5 g | 2.1 −28% |
| Salt | 0.1 g | 2.1 −95% |
*% Daily Value for 100 g, based on a 2,000-calorie diet (FDA reference values). Category average across 225 Prawn crackers products on Foodmetria.
Compared with other prawn crackers
Bar shows the share of products in this category that contain less of the nutrient.
Product details
- Labels & certifications
- 100% natural
- Sold in
- Belgium
- Barcode
- 8717662263613
Prices reported by shoppers
Loading prices…
Frequently asked questions
How many calories are in Kentang manis pedis?
Kentang manis pedis contains 375 kcal per 100 g.
How much sugar is in Kentang manis pedis?
Kentang manis pedis has 3.5 g of sugars per 100 g, which is considered low by UK front-of-pack guidelines.
Is Kentang manis pedis healthy?
It has a Nutri-Score of C (A is best, E is worst). Scores describe nutritional quality and processing, not suitability for your individual diet.
Source: Open Food Facts (ODbL). Last updated March 31, 2026. Spotted a mistake? Edit this product on Open Food Facts. Not medical advice — always check the package label.
Reviews
Compare & rankings
Healthier alternatives
Best in category →Same category, meaningfully better on at least one measure and no worse on the others. Each card shows what improves.

More prawn crackers
View all → e NOVA 3
  e NOVA 3
  d NOVA 3
  e NOVA 3
  e NOVA 3
  e NOVA 3