
POINTE DE BRIE DE MEAUX AOP LC 200G Massif TRAD vs Fromage Pointe Brie Nos Régions ont du Talent
Overall, POINTE DE BRIE DE MEAUX AOP LC 200G Massif TRAD has the better nutritional profile on the measures we compare. It wins on 1 of our comparison points versus 0.
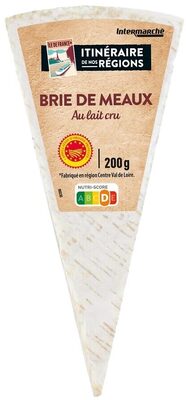
POINTE DE BRIE DE MEAUX AOP LC 200G Massif TRAD
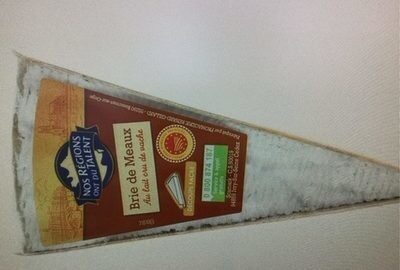
Fromage Pointe Brie Nos Régions ont du Talent
Nutrition per 100 g
| Nutrient | POINTE DE BRIE DE MEAUX AOP... | Fromage Pointe Brie Nos Régi... |
|---|---|---|
| Nutri-Score | d | d |
| NOVA group | 3 | — |
| Calories | 289 kcal | 286 kcal |
| Fat | 22 g | 22 g |
| Saturated fat | 15 g | 15 g |
| Sugars | 0.5 g | 0.5 g |
| Salt | 1.8 g | 1.8 g |
| Fiber | 0.5 g | 0 g |
| Protein | 22 g | 22 g |
| Additives | 0 | 0 |
| Allergens | Milk | None listed |
Green = better value for that nutrient (less sugar, fat, salt and calories; more fiber and protein).
Key differences
- POINTE DE BRIE DE MEAUX AOP LC 200G Massif TRAD has 100% more fiber (0.5 g vs 0 g).
- Only POINTE DE BRIE DE MEAUX AOP LC 200G Massif TRAD lists: Milk.
Ingredients
POINTE DE BRIE DE MEAUX AOP LC 200G Massif TRAD
Lait cru de vache, sel, présure, ferments lactiques (dont lait), ferments d'affinage.
Fromage Pointe Brie Nos Régions ont du Talent
Not available.
FAQ
Which is healthier: POINTE DE BRIE DE MEAUX AOP LC 200G Massif TRAD or Fromage Pointe Brie Nos Régions ont du Talent?
Overall, POINTE DE BRIE DE MEAUX AOP LC 200G Massif TRAD has the better nutritional profile on the measures we compare. We compare Nutri-Score, processing level and seven nutrients per 100 g. Your own needs (for example low sugar or high protein) may make a different choice better for you.
Which has fewer calories?
Fromage Pointe Brie Nos Régions ont du Talent has fewer calories: 286 kcal versus 289 kcal per 100 g.
Which has less sugar?
POINTE DE BRIE DE MEAUX AOP LC 200G Massif TRAD has less sugar: 0.5 g versus 0.5 g per 100 g.