Top 10 · Updated October 2026

Least Processed Trail Mix

2 of the top 10 trail mix products sit in NOVA group 1 — the least processed end of the scale. The trail mix with the lowest NOVA processing group — fewer industrial ingredients and additives. We checked 79 trail mix with complete data.

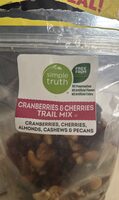
  1. 1 Cranberries & Cherries Trail Mix

    Cranberries & Cherries Trail Mix

    simple truth
    NOVA 1 340 kcal 33.3 g sugar 10 g protein 30 g fat

    Also: Palm oil free · Vegan · Vegetarian

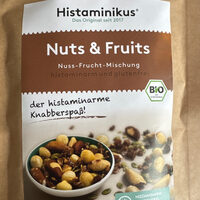
  2. 2 Nuts & Fruits

    Nuts & Fruits

    Histaminikus · 250 g
    NOVA 1

    Also: No additives

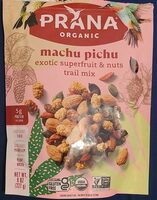
  3. 3 Machu Pichu

    Machu Pichu

    Prana · 8 oz
    a NOVA 3 433 kcal 15.3 g sugar 13.3 g protein 23.3 g fat

    Also: Palm oil free · No additives

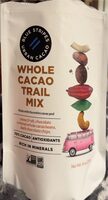
  4. 4 Whole Cacao Trail Mix

    Whole Cacao Trail Mix

    Blue Stripes · 8 oz
    c NOVA 3 567 kcal 13.5 g sugar 14.1 g protein 49.5 g fat

    Also: Palm oil free · No additives

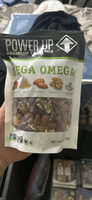
  5. 5 Mega Omega

    Mega Omega

    Power Up · 84 g
    c NOVA 3 467 kcal 36.7 g sugar 10 g protein 26.7 g fat

    Also: Palm oil free · Vegan · Vegetarian

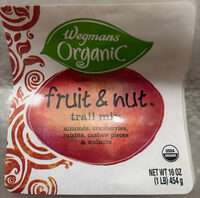
  6. 6 Fruit & nut trail mix

    Fruit & nut trail mix

    Wegmans · 16 oz
    c NOVA 3 467 kcal 33.3 g sugar 10 g protein 23.3 g fat

    Also: Palm oil free · Vegetarian · No additives

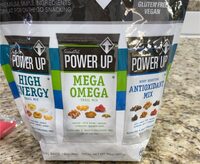
  7. 7 Power up

    Power up

    · 36 oz
    d NOVA 3 465 kcal 39.5 g sugar 4.7 g protein 23.3 g fat

    Also: Vegan · Vegetarian

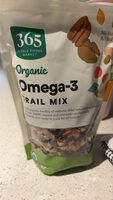
  8. 8 Organic Omega-3 Trail Mix

    Organic Omega-3 Trail Mix

    365 by Whole Foods Market · 12 oz
    d NOVA 3 533 kcal 23.3 g sugar 13.3 g protein 43.3 g fat

    Also: Palm oil free · Vegetarian · No additives

  9. 9 Simply the Best Trek Mix

    Simply the Best Trek Mix

    Trader Joe's · 16 oz
    d NOVA 3 500 kcal 26.7 g sugar 13.3 g protein 33.3 g fat

    Also: Palm oil free · Vegetarian · No additives

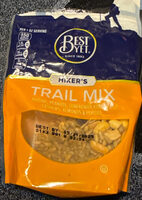
  10. 10 Hiker's trail mix

    Hiker's trail mix

    d NOVA 3 536 kcal 17.9 g sugar 17.9 g protein 39.3 g fat

    Also: Palm oil free · No additives

How we built this list

We ranked all published trail mix on Foodmetria that have a photo and the required nutrition data, using values per 100 g from the product label. Ties are broken by Nutri-Score and by how often shoppers scan the product. Rankings update automatically as label data changes. Read our methodology.

More trail mix rankings