Top 10 · Updated October 2026

Highest-Protein Flavored Teas

Flavored teas: typically 0 g of protein per 100 g (median of 148 products). The flavored teas with the most protein per 100 g. Useful if you are trying to increase your protein intake. We checked 72 flavored teas with complete data.

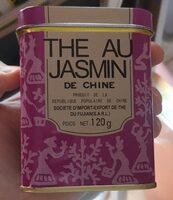
  1. 1 Thé au jasmin

    Thé au jasmin

    · 120 g
    359 kcal 0 g sugar 26.2 g protein 2 g fat
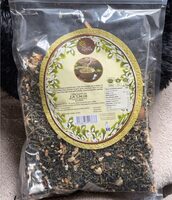
  2. 2 Thé vert au jasmin

    Thé vert au jasmin

    Palais Imperial · 500g
    e NOVA 4 363 kcal 18.2 g sugar 18.7 g protein 2.3 g fat

    Also: No additives

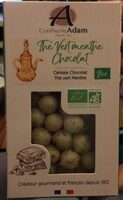
  3. 3 The vert menthe chocolat

    The vert menthe chocolat

    e 561 kcal 39 g sugar 5.6 g protein 35 g fat
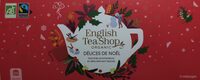
  4. 4 Délices de Noël

    Délices de Noël

    English Tea Shop · 48g
    b NOVA 4 151 kcal 1 g sugar 5.4 g protein 6.5 g fat

    Also: Palm oil free · No additives

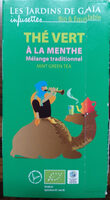
  5. 5 Thé vert à la menthe

    Thé vert à la menthe

    Les Jardins de Gaïa · 36 g (20 x 1,8g)
    c NOVA 1 26 kcal 2.1 g sugar 1.4 g protein 0.3 g fat

    Also: Palm oil free · Vegan · Vegetarian

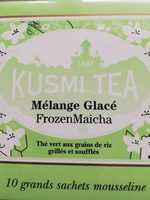
  6. 6 The vert aux grains de riz grilles et soufflés

    The vert aux grains de riz grilles et soufflés

    Kusmi Tea · 90g
    d 1 kcal 2 g sugar 1 g protein 1 g fat
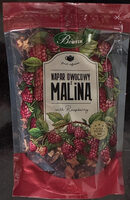
  7. 7 Napar owocowy z maliną

    Napar owocowy z maliną

    Bifix · 100 g
    c NOVA 4 48 kcal 6.5 g sugar 0.7 g protein 0.5 g fat

    Also: Palm oil free · No additives

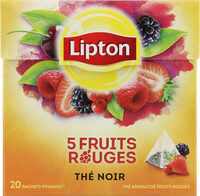
  8. 8 Lipton Thé 5 Fruits Rouges 20 Sachets

    Lipton Thé 5 Fruits Rouges 20 Sachets

    Lipton · 34 g
    b NOVA 4 4 kcal 0.5 g sugar 0.5 g protein 0 g fat

    Also: Palm oil free · No additives

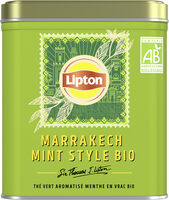
  9. 9 Lipton Thé Vert Bio Marrakech Mint 145g

    Lipton Thé Vert Bio Marrakech Mint 145g

    Lipton · 145 g
    b NOVA 4 4 kcal 0.5 g sugar 0.5 g protein 0.5 g fat

    Also: No additives

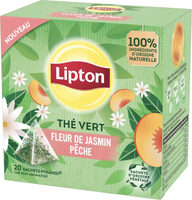
  10. 10 Thé vert fleur de jasmin pêche

    Thé vert fleur de jasmin pêche

    Lipton · 30g
    b NOVA 4 4 kcal 0.5 g sugar 0.5 g protein 0.5 g fat

    Also: Palm oil free · No additives

How we built this list

We ranked all published flavored teas on Foodmetria that have a photo and the required nutrition data, using values per 100 g from the product label. Ties are broken by Nutri-Score and by how often shoppers scan the product. Rankings update automatically as label data changes. Read our methodology.

More flavored teas rankings